Explanatory Post
2025
INFO-608-01
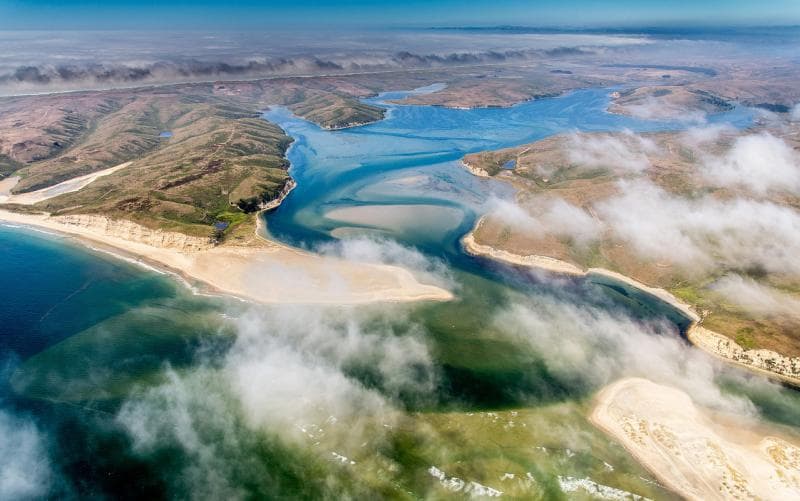
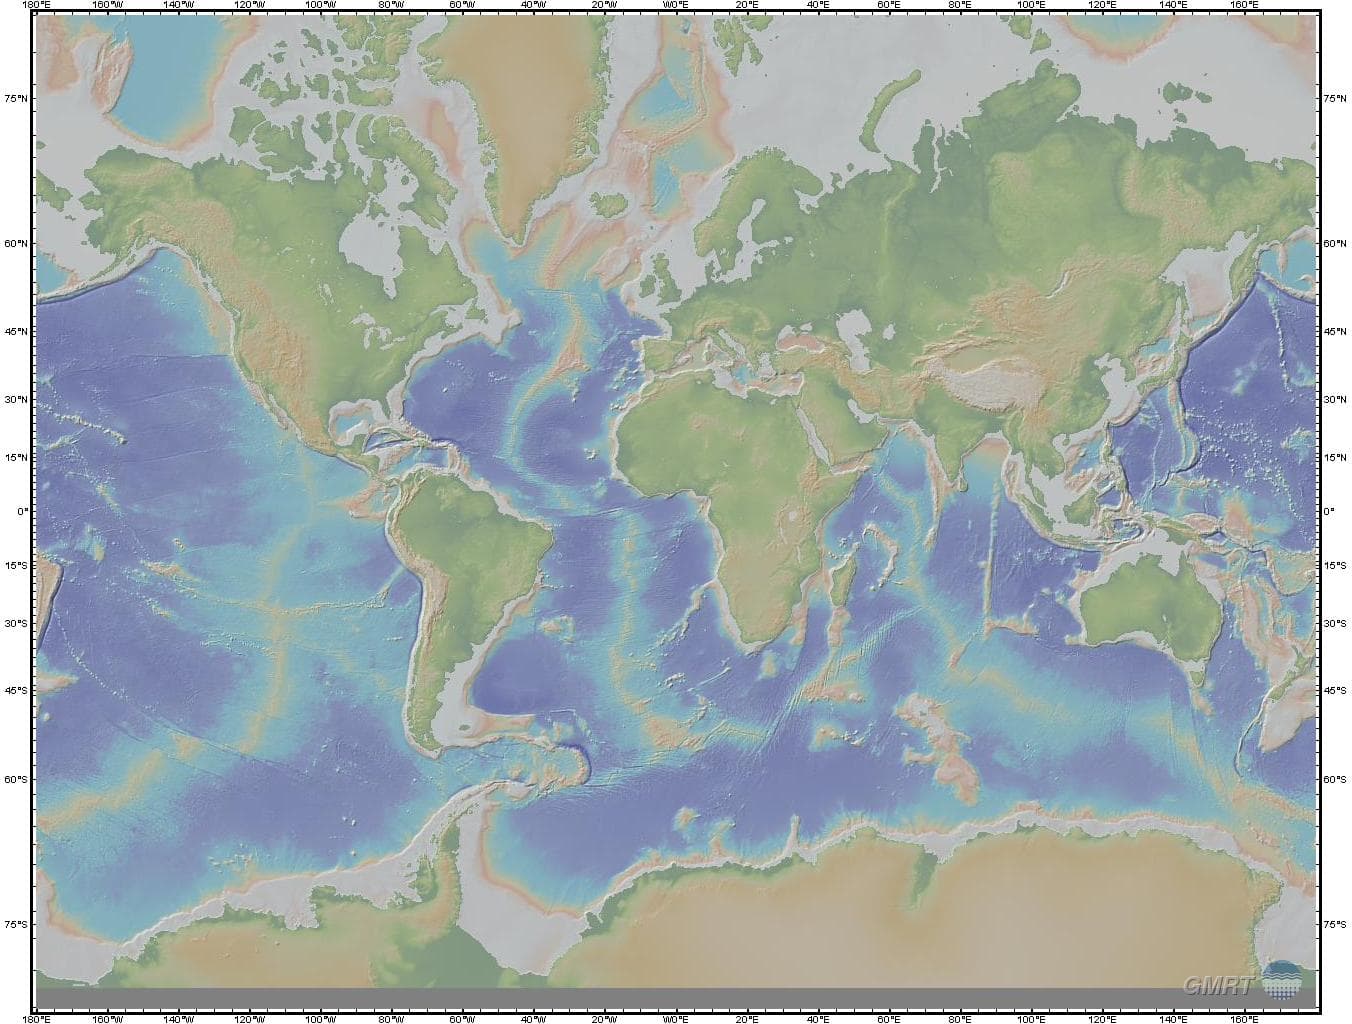
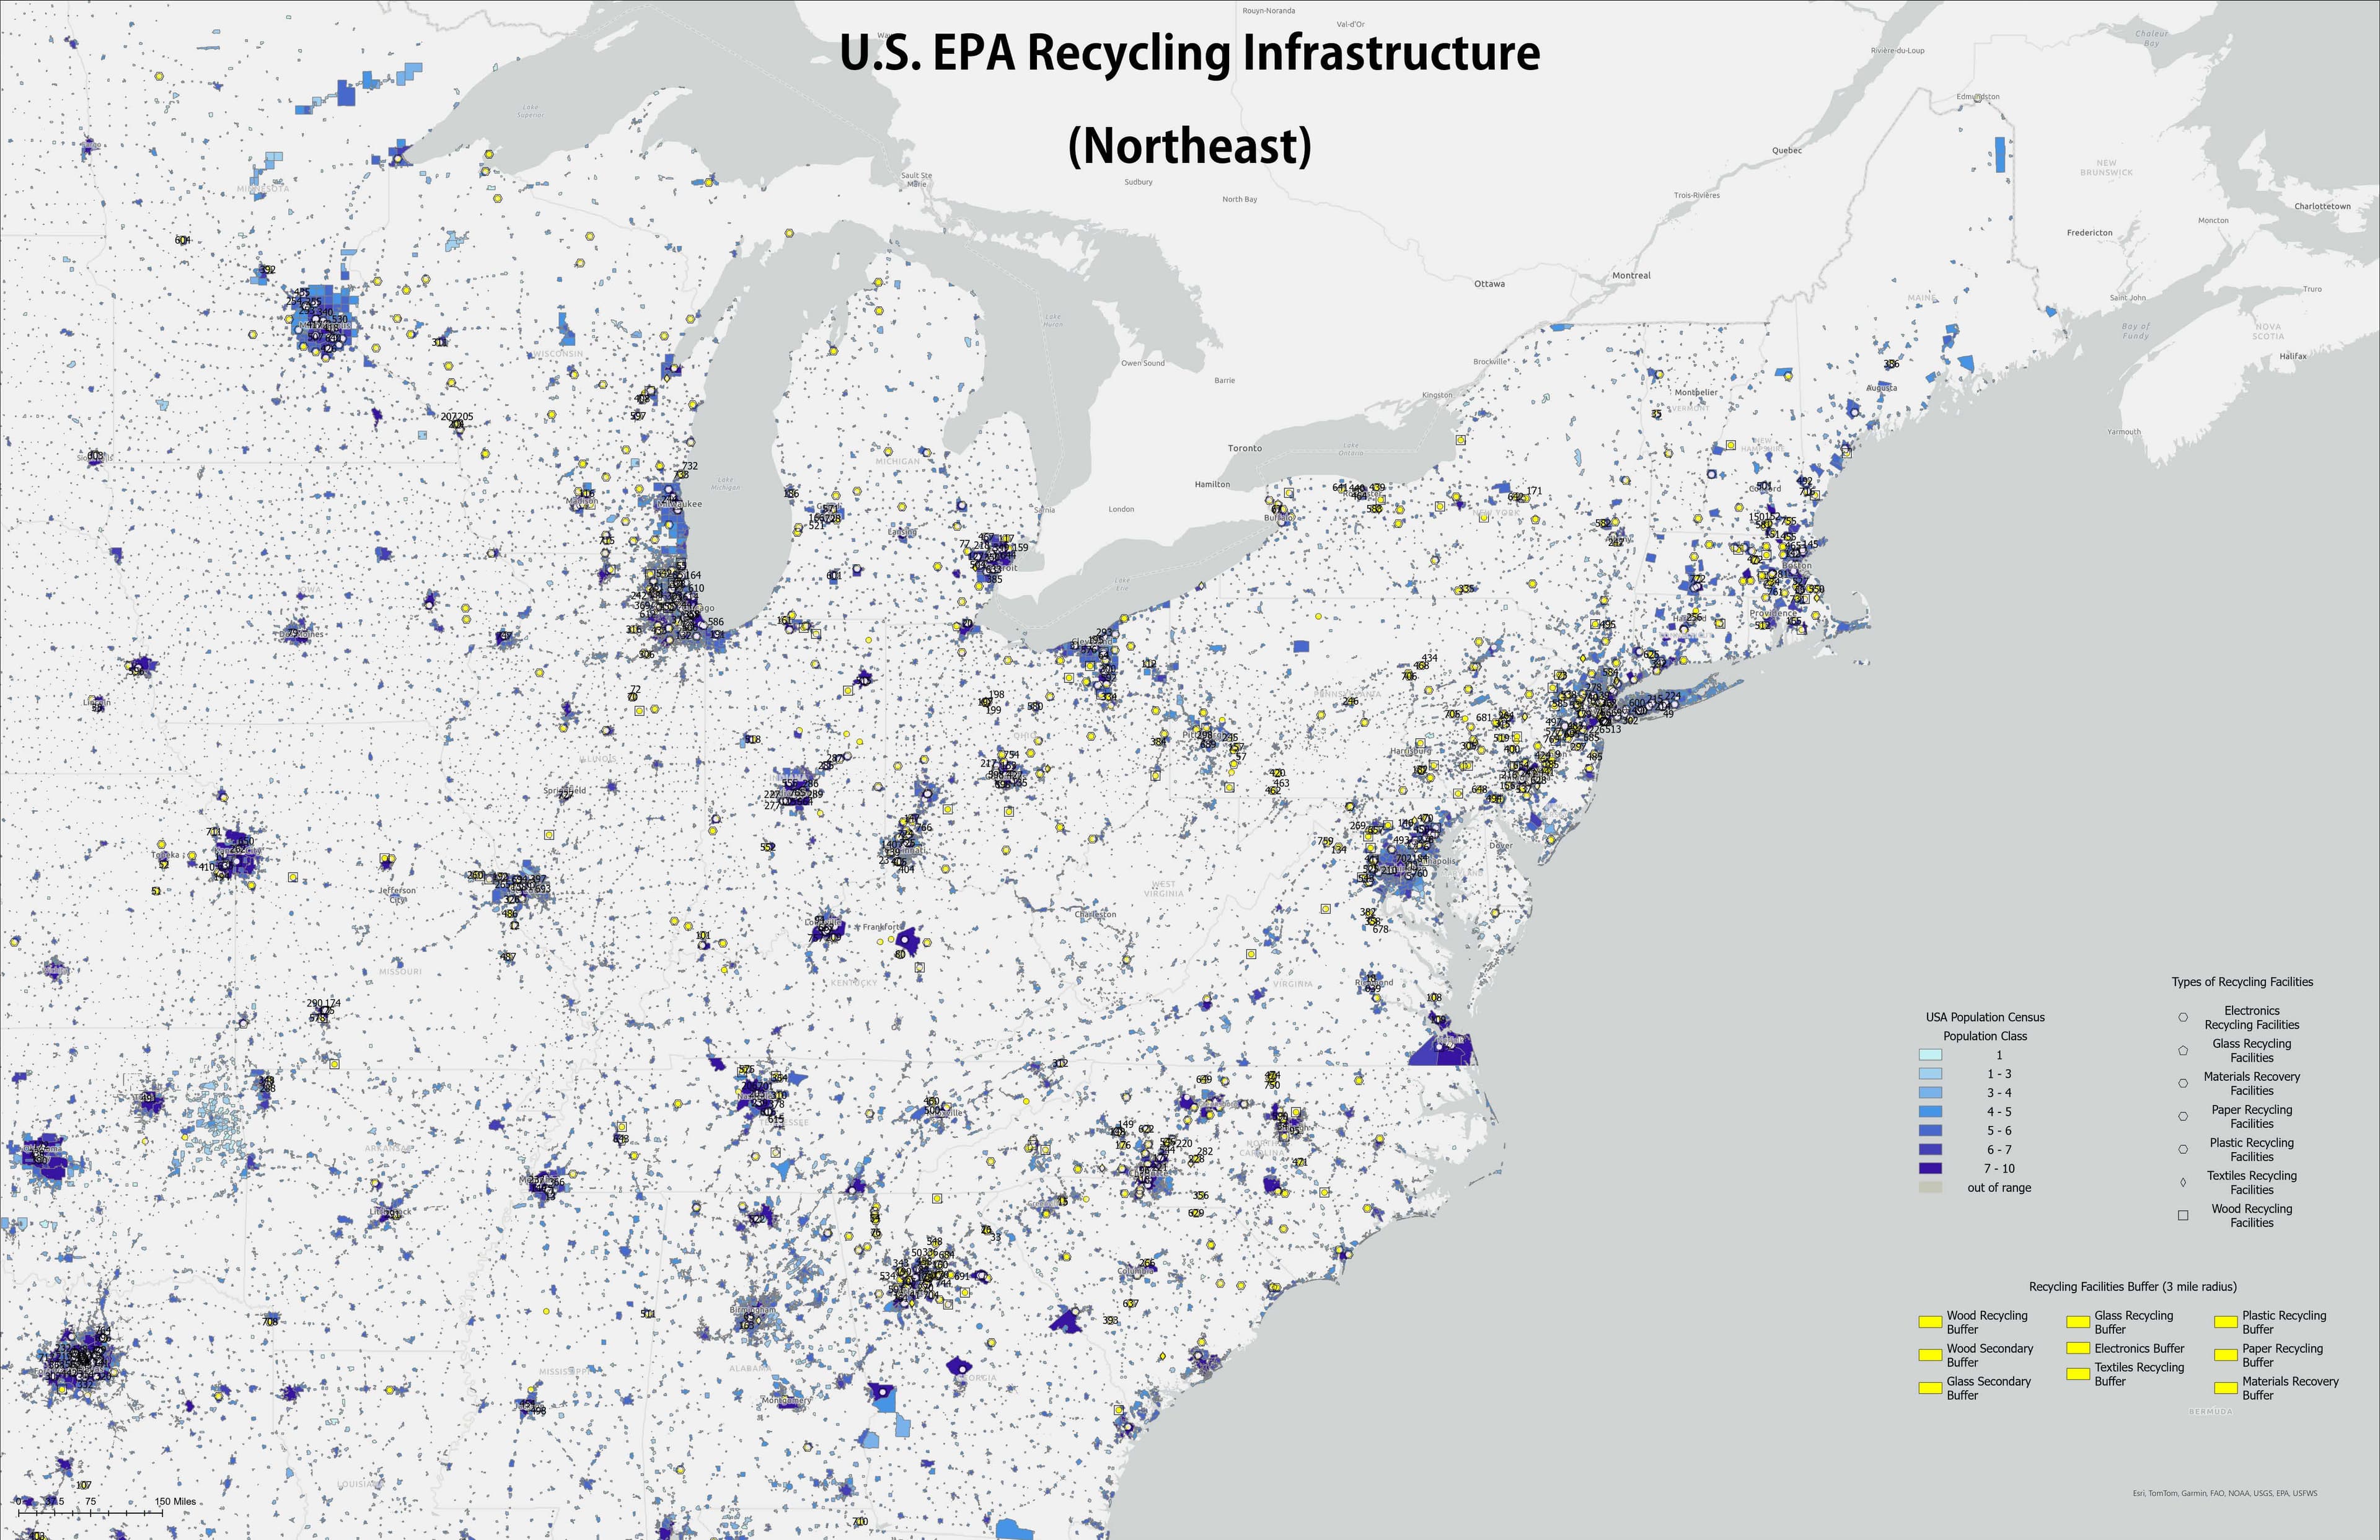
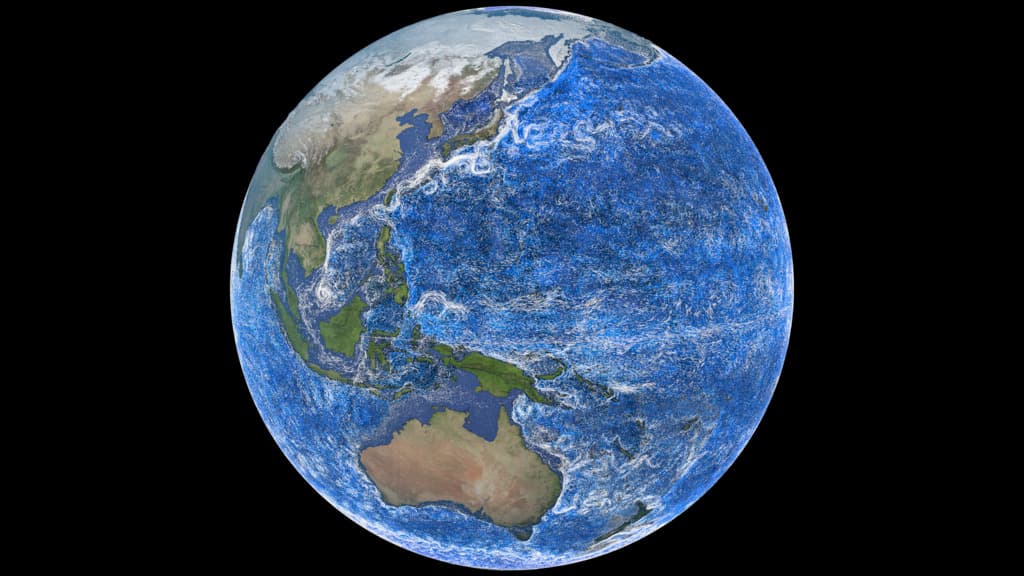
Visualizing Water
A case study tracing the evolution of water and ocean imagery, analyzing its influence on public understanding and policy, and proposing a new approach to designing visual tools that are more inclusive, accurate, and empowering.
5
Tools
2025
Year
INFO-608-01
Course
GISCritical CartographyWater Systems
View